cuda toolkit: compilers, libraries, and the host-device model
the software stack that makes gpu programming possible - nvcc compiler pipeline, cublas/cudnn libraries, the host-device memory model, cuda execution flow, and the profiling tools every sre should know.
In the first post we covered GPU performance metrics - bandwidth, TFLOPS, precision. In the second, we went inside the SM and traced how warps execute on partitions. This post connects the software to the hardware: the CUDA Toolkit - the full stack of compilers, libraries, runtime APIs, and profiling tools that let you actually program a GPU.
CUDA stands for Compute Unified Device Architecture. It's NVIDIA's proprietary parallel computing platform, and understanding its components is essential whether you're writing CUDA kernels yourself or just trying to understand why your ML framework needs a specific CUDA version installed.
The Host-Device Model
Every CUDA program operates on a fundamental assumption: there are two separate processors with separate memory.
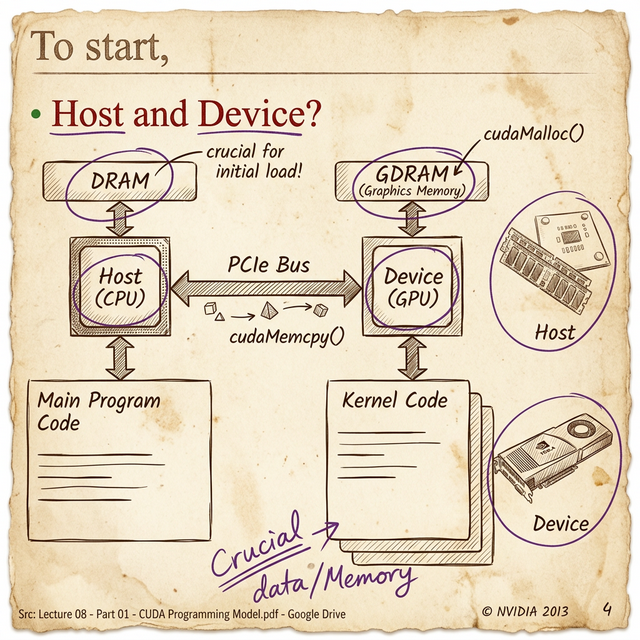
- The Host = the CPU and its system memory (DRAM)
- The Device = the GPU and its graphics memory (GDRAM/HBM)
- The PCIe Bus = the bridge between them
This is the most important thing to internalize about GPU programming: the CPU and GPU have completely separate memory spaces. Data doesn't magically appear on the GPU. You have to explicitly:
- Allocate memory on the GPU -
cudaMalloc() - Copy data from CPU memory to GPU memory -
cudaMemcpy(Host → Device) - Launch a kernel (GPU function) -
kernel<<<blocks, threads>>>() - Copy results back from GPU to CPU -
cudaMemcpy(Device → Host) - Free the GPU memory -
cudaFree()
That PCIe transfer is the bottleneck in many GPU applications. PCIe Gen4 ×16 gives you ~32 GB/s in each direction - compare that to the A100's 2 TB/s internal memory bandwidth. You're looking at a 60× gap between how fast the GPU can process data internally and how fast you can feed it new data from the CPU.
The first question in GPU optimization isn't "how do I make the kernel faster?" - it's "how do I minimize the data transfer?" Experienced CUDA developers keep data on the GPU as long as possible and batch transfers to amortize the PCIe overhead.
This is also why NVIDIA invested in Unified Memory (cudaMallocManaged()) - it creates a single address space that the runtime automatically migrates between CPU and GPU. It simplifies programming but doesn't eliminate the transfer cost; it just hides it.
GPGPU: General-Purpose Computing on GPUs
Before CUDA (pre-2007), GPUs could only run graphics shaders. If you wanted to do matrix math on a GPU, you had to disguise your computation as a pixel shader - seriously. The data went in as "textures" and came out as "pixel colors."
CUDA changed that by making the GPU a general-purpose compute device. This is what GPGPU (General-Purpose computing on Graphics Processing Units) means: using a GPU for anything beyond graphics rendering - scientific simulation, machine learning, data analytics, cryptography.
The term "GPGPU" is sometimes used interchangeably with "GPU computing," but technically GPGPU specifically refers to non-graphics workloads running on GPU hardware. Every time you run a PyTorch model on a CUDA device, that's GPGPU.
The nvcc Compiler: From Source to Silicon
The CUDA compiler is nvcc (NVIDIA CUDA Compiler). It's not a simple compiler - it's a compiler driver that orchestrates a multi-stage compilation pipeline.
Here's what happens when you compile a .cu file:
- Separation - nvcc separates your code into host code (regular C/C++) and device code (CUDA kernels marked with
__global__or__device__) - Host compilation - the host code is passed to your system's C++ compiler (gcc, clang, or MSVC)
- Device compilation - the device code is compiled to PTX (Parallel Thread Execution), NVIDIA's intermediate assembly language
- Assembly - PTX is assembled into SASS (Shader ASSembly), the native machine code for a specific GPU architecture
- Linking - host and device code are linked into a single executable
PTX is worth understanding. It's NVIDIA's equivalent of LLVM IR or Java bytecode - a architecture-independent intermediate representation. When you compile for a specific compute capability (e.g., -arch=sm_80), nvcc generates SASS code optimized for that exact architecture. But you can also embed PTX in your binary so that the CUDA driver can JIT-compile it for whatever GPU the user actually has.
The
-gencodeflag in nvcc lets you target multiple architectures in a single binary:-gencode arch=compute_70,code=sm_70 -gencode arch=compute_80,code=sm_80. This is how libraries like PyTorch support multiple GPU generations without separate builds.
CUDA Libraries: Standing on NVIDIA's Shoulders
Most people never write raw CUDA kernels. Instead, they use NVIDIA's highly optimized libraries that do the heavy lifting:
| Library | Purpose | CPU Equivalent |
|---|---|---|
| cuBLAS | GPU-accelerated linear algebra (matrix multiply, etc.) | OpenBLAS, MKL |
| cuDNN | Deep learning primitives (convolution, pooling, normalization) | – |
| cuFFT | Fast Fourier Transform | FFTW |
| cuRAND | Random number generation | std::random |
| cuSPARSE | Sparse matrix operations | SuiteSparse |
| Thrust | High-level parallel algorithms (sort, reduce, scan) | C++ STL algorithms |
| NCCL | Multi-GPU and multi-node collective communications | MPI |
When PyTorch calls torch.matmul() on a CUDA tensor, it's calling cuBLAS under the hood. When you run a Conv2d layer, that's cuDNN. These libraries are the reason GPU deep learning is fast - NVIDIA engineers have hand-optimized them for each architecture down to the instruction level.
From an SRE perspective, this means that CUDA toolkit versions matter. cuDNN 8.x behaves differently from 9.x. A library compiled against CUDA 11.8 may not work with CUDA 12.0. These version dependencies are the source of an enormous number of "works on my machine" GPU debugging sessions.
Runtime API vs Driver API
CUDA actually provides two levels of API:
- Runtime API (higher-level) - this is what 99% of CUDA code uses. Functions like
cudaMalloc(),cudaMemcpy(), and the<<<blocks, threads>>>kernel launch syntax. It handles context management, module loading, and error checking automatically. - Driver API (lower-level) - functions prefixed with
cu(notcuda):cuMemAlloc(),cuLaunchKernel(). You manage contexts, modules, and memory explicitly. More control, more boilerplate.
The driver API exists for edge cases: building GPU runtimes, loading PTX at runtime, managing multiple GPU contexts manually. If you're writing application code, stick with the runtime API.
The Execution Pipeline: Code to Cores
Now let's trace what happens when your CUDA program actually runs on the GPU. This connects everything from the previous two posts:
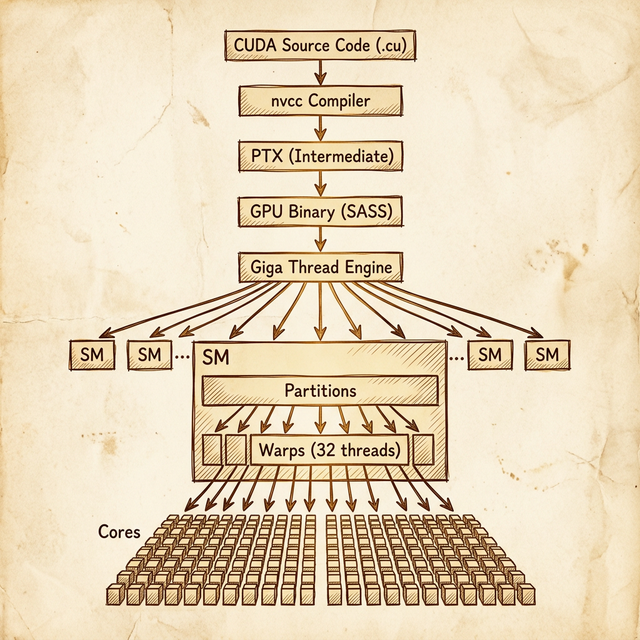
- Your .cu source code gets compiled by nvcc into PTX → SASS binary
- At runtime, you call a kernel launch:
kernel<<<gridDim, blockDim>>>(args) - The CUDA runtime sends the kernel to the GPU's Giga Thread Engine - the top-level hardware scheduler
- The Giga Thread Engine distributes thread blocks across available SMs. Each SM gets one or more blocks depending on resource availability
- Within each SM, blocks are divided into warps (32 threads each)
- Warps are assigned to SM partitions, where the partition's warp scheduler manages their execution
- Each cycle, the warp scheduler selects a ready warp and dispatches its instruction to the cores (FP32, FP64, INT, tensor)
The key insight: the Giga Thread Engine is the GPU's "operating system." It handles block-to-SM assignment, and from there the SM hardware takes over with warp scheduling. As a programmer, you control the grid dimensions (how many blocks) and block dimensions (how many threads per block). The hardware handles everything below that.
The Grid, Block, and Thread Hierarchy
When you launch a kernel, you specify:
- Grid = the total collection of all thread blocks (1D, 2D, or 3D)
- Block = a group of threads that execute on the same SM and can share memory (1D, 2D, or 3D)
- Thread = a single execution unit
For example, launching kernel<<<dim3(16, 16), dim3(32, 32)>>>() creates:
- A grid of 16 × 16 = 256 blocks
- Each block has 32 × 32 = 1,024 threads
- Total: 256 × 1,024 = 262,144 threads
- Each block produces 1,024 / 32 = 32 warps
All 262,144 threads run the same kernel function, but each one knows its position via built-in variables (threadIdx, blockIdx, blockDim, gridDim) so it can work on its own slice of data.
Profiling and Debugging Tools
NVIDIA ships a full suite of profiling and debugging tools with the CUDA Toolkit. These are essential for production GPU workloads:
| Tool | Purpose | When to Use |
|---|---|---|
| Nsight Systems | System-level profiler - CPU + GPU timeline, kernel launches, memory transfers | First pass: "where is time being spent?" |
| Nsight Compute | Kernel-level profiler - SM utilization, memory throughput, warp stalls | Deep dive: "why is this kernel slow?" |
| cuda-gdb | GPU-aware debugger - set breakpoints in kernels, inspect thread state | Debugging kernel logic errors |
| compute-sanitizer | Memory error detection - out-of-bounds access, race conditions, leaks | Catching memory bugs (like GPU Valgrind) |
| nvidia-smi | GPU management CLI - utilization, temperature, memory usage, clock speeds | Real-time monitoring and health checks |
For SREs, nvidia-smi is the one you'll use daily. It's the top or htop equivalent for GPUs:
$ nvidia-smi
+-----------------------------------------------------------------------------+
| GPU  Name        Persistence-M| Bus-Id        Disp.A | Volatile Uncorr. ECC |
| Fan  Temp  Perf  Pwr:Usage/Cap|         Memory-Usage | GPU-Util  Compute M.  |
|=============================================================================|
|   0  A100-SXM4-80GB      On  | 00000000:07:00.0 Off |                    0 |
| N/A   34C    P0    52W / 400W |    345MiB / 81920MiB |      0%      Default |
+-----------------------------------------------------------------------------+
Key metrics to watch: GPU-Util (compute utilization - low means the GPU is idle or memory-bound), Memory-Usage (OOM errors come from here), Temperature (throttling starts around 80–85°C on most data center GPUs), and ECC errors (non-zero uncorrected ECC means hardware is failing).
Getting Started: CUDA Samples
The CUDA Toolkit ships with a samples directory full of example programs. Two worth running first:
deviceQuery- prints your GPU's compute capability, SM count, memory, clock speeds, and supported features. Run this first to verify your CUDA installation is working.bandwidthTest- measures host-to-device, device-to-host, and device-to-device transfer speeds. Good for verifying PCIe bandwidth and detecting hardware issues.
These are the GPU equivalent of "Hello World" - they confirm that the driver, runtime, and hardware are all talking to each other correctly.
Wrapping Up the Series
Across these three posts, we've traced the full path from silicon to software:
- Performance metrics - bandwidth, TFLOPS, precision, and tensor cores tell you what a GPU can do
- SM internals - partitions, warp schedulers, and the SIMT model show you how it does it
- The CUDA toolkit - compilers, libraries, and the host-device model give you the tools to make it do it
The through-line: GPU programming is about understanding the hierarchy at every level - from the chip's architecture down to individual warps, from the high-level cuBLAS call down to the PTX instruction it compiles to. The more layers you understand, the better you can diagnose why a workload is slow, why a toolkit version matters, or why a particular GPU is the right (or wrong) choice for your use case.
Learn the hardware. Learn the toolkit. Then the specs sheets start making sense.
Resources
backlinks 0
see also
get the rest of the series.
i'll send each new essay the morning it ships. nothing else.